
LinkedIn is a great platform to showcase your professional brand and share your expertise with a larger audience.
When you share content on LinkedIn, it is important to track its performance and see how it is resonating with your audience.
That's where LinkedIn's post analytics come in. In this blog post, we'll provide a step-by-step guide on how to view post analytics for your content on LinkedIn.
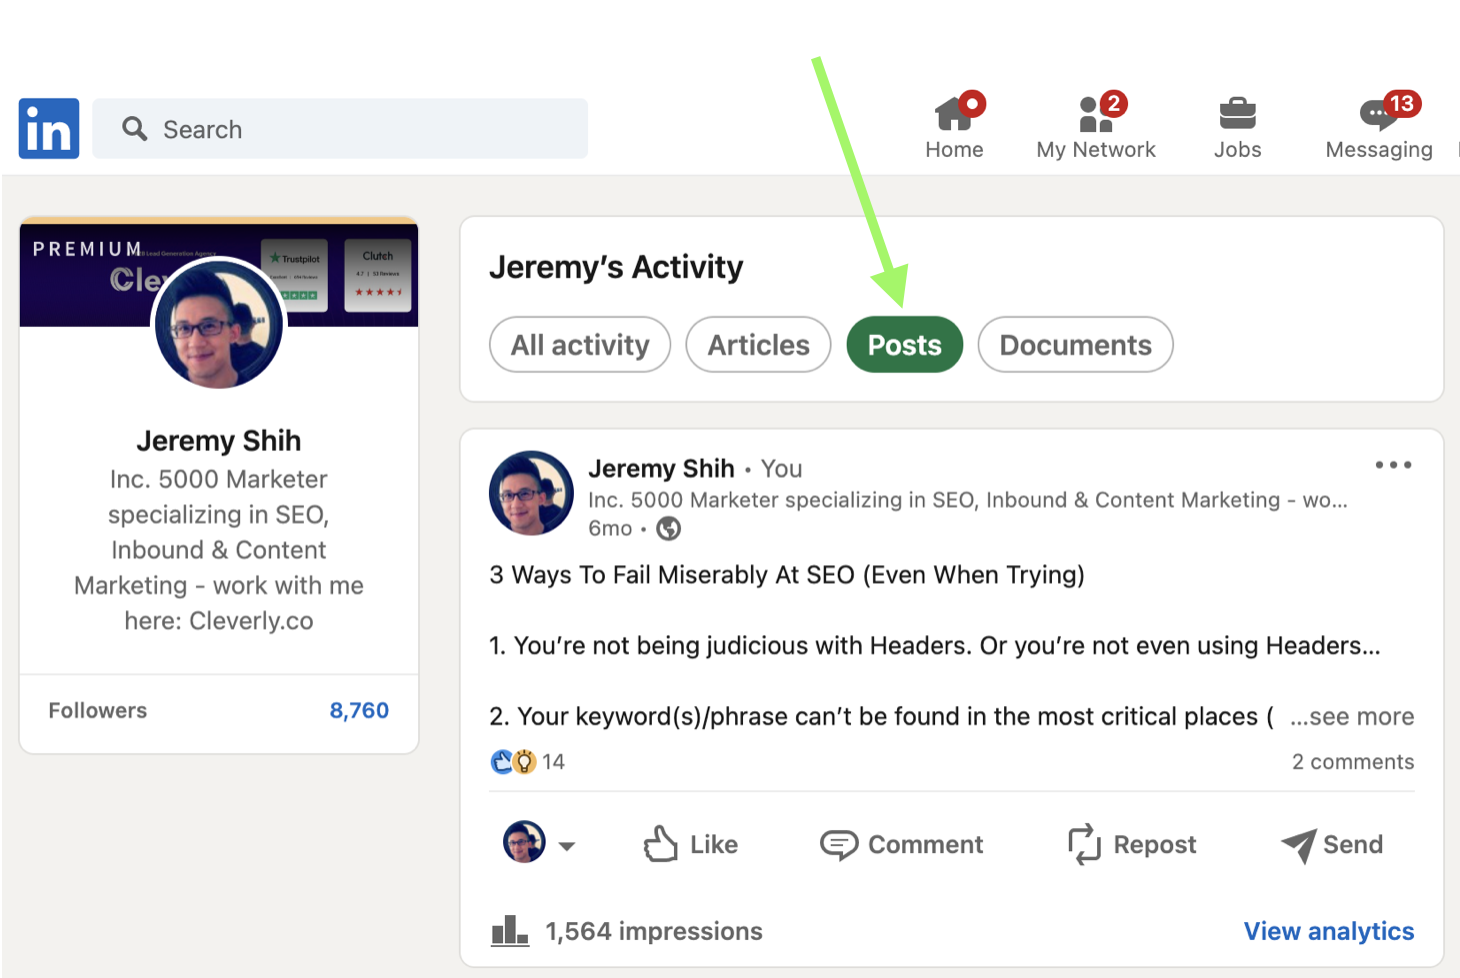
Step 1: Navigate to the post you want to view the analytics for on LinkedIn
First, you need to navigate to the post for which you want to view the analytics. You can do this by going to your LinkedIn homepage, scrolling through your feed until you find the post, or searching for the post using keywords.
Step 2: Scroll down to the bottom of the desired post where it says "View analytics".
Once you have located the post, scroll to the bottom of the post where it lists impressions on the bottom left and "View analytics" in blue on the bottom right.
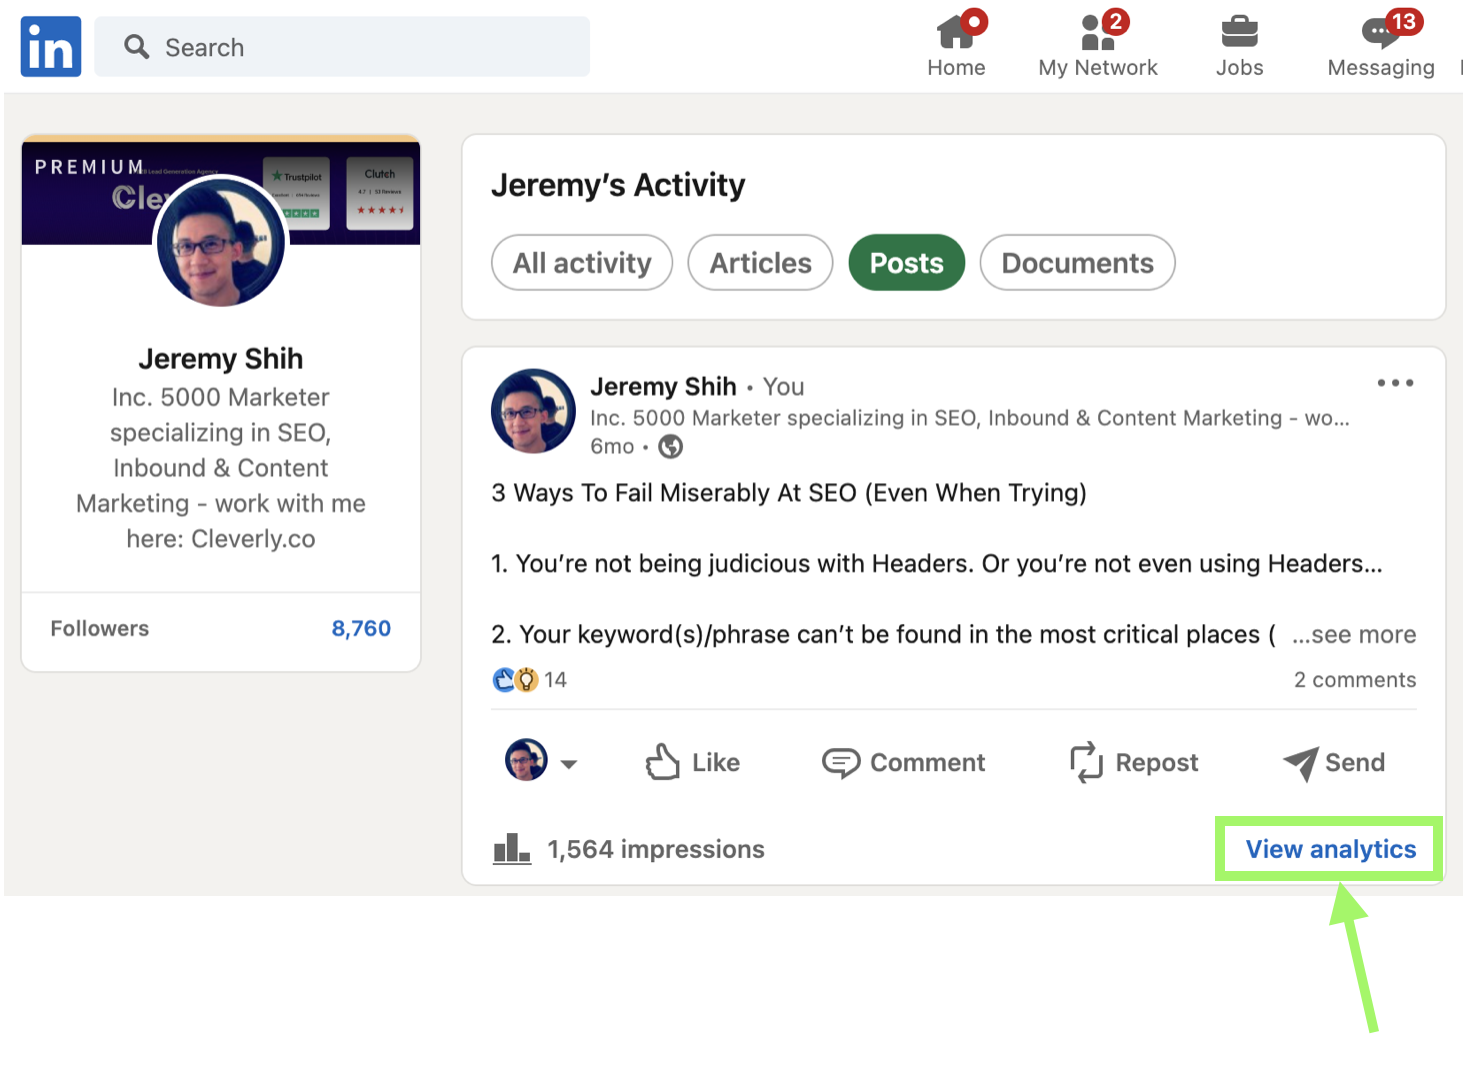
Step 3: Click "View analytics" at the bottom right hand corner of your post.
At the bottom right hand corner of your post, click "View analytics." This will take you to a page that shows you the post analytics.
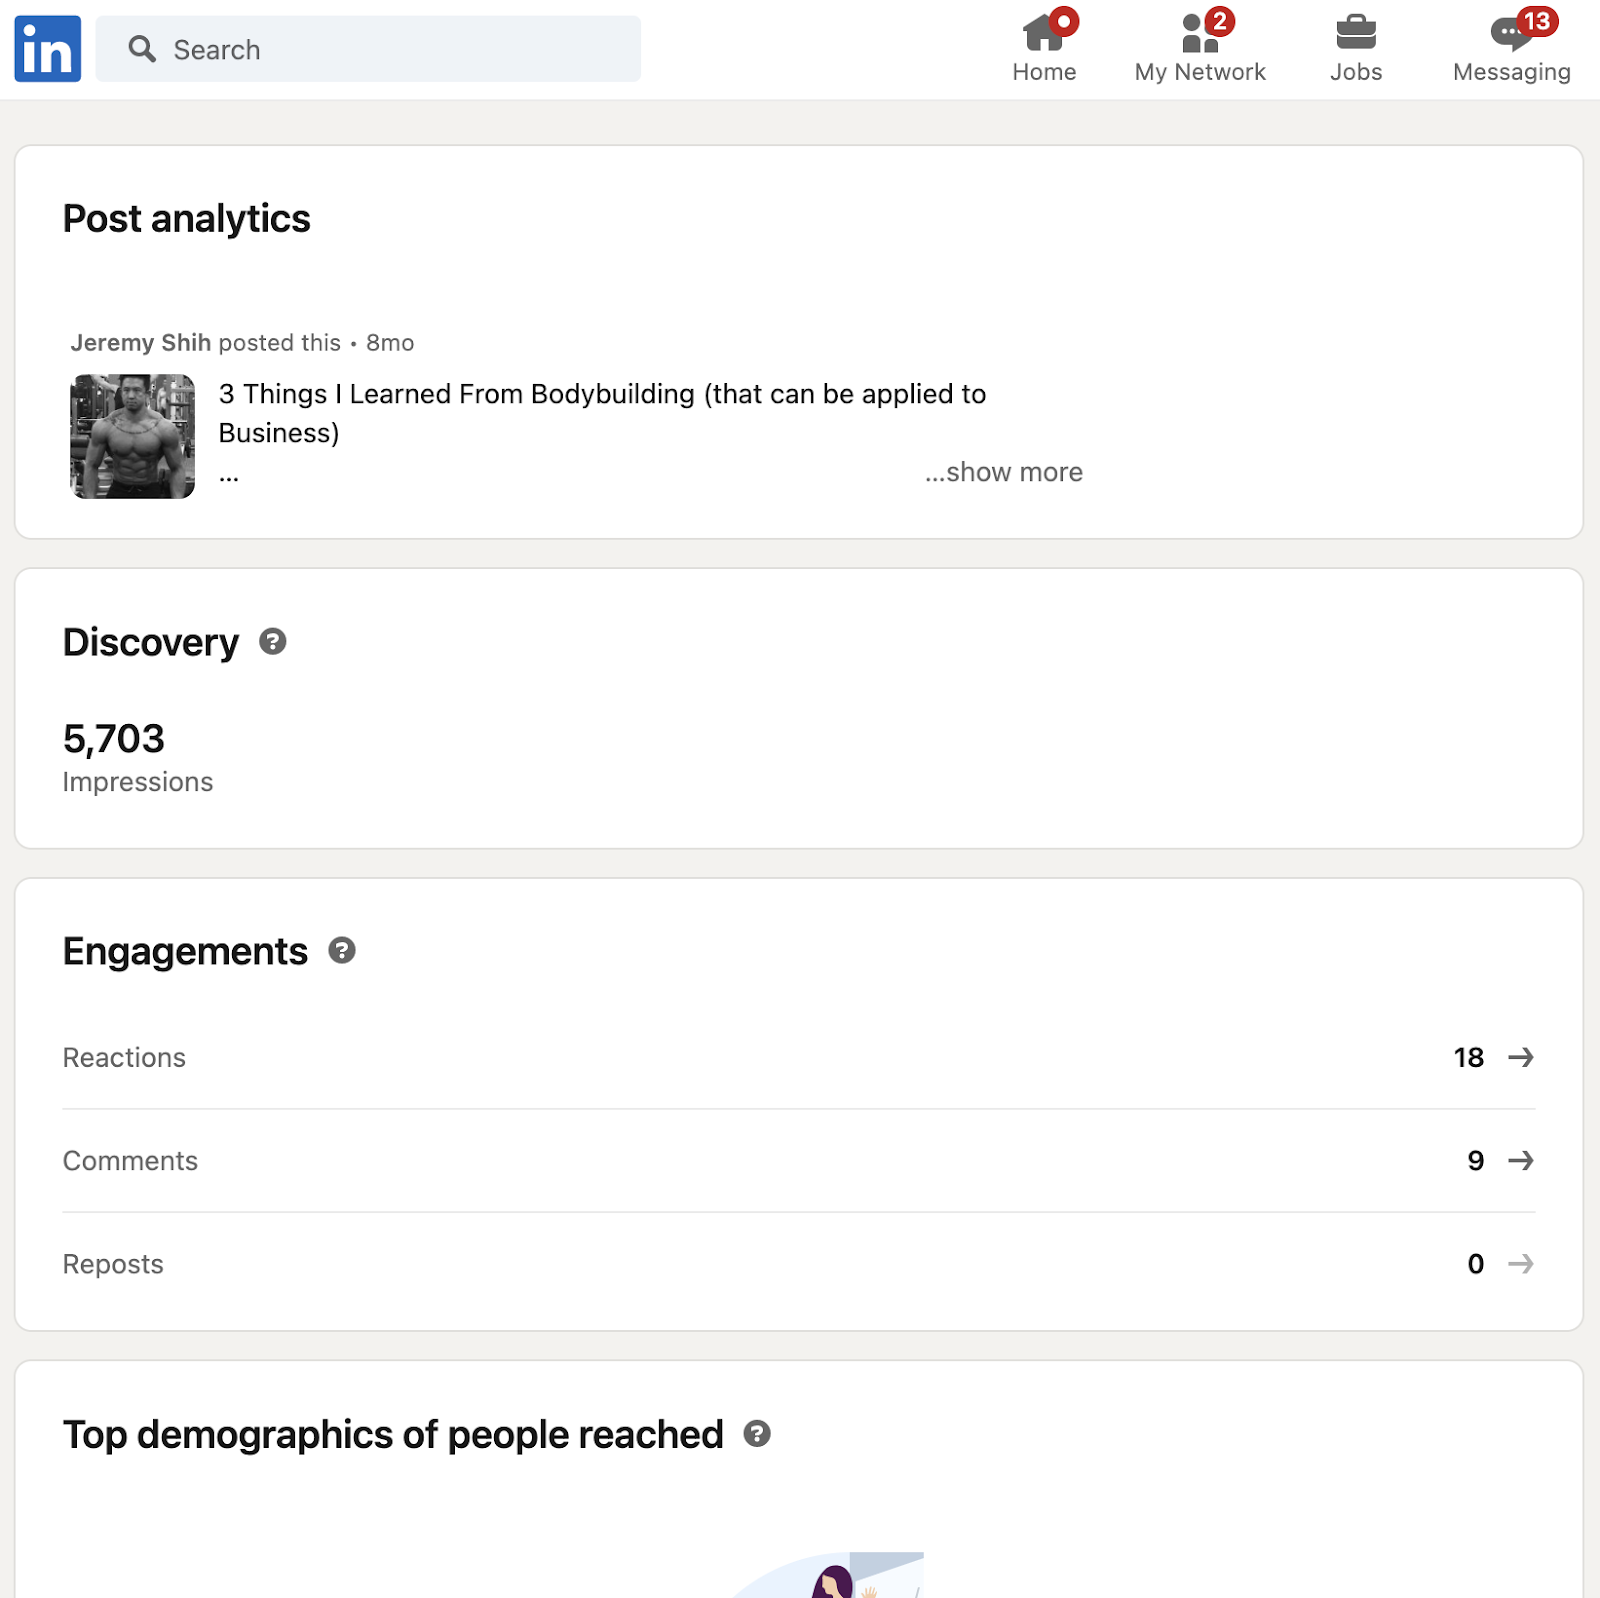
Step 4: Review the analytics data
On the analytics page, you will see a variety of data related to your post's performance. The data includes the number of views, likes, comments, and shares your post has received.
You can also see the number of clicks, the engagement rate, and the demographics of your audience.
When viewing post analytics for your content on LinkedIn, you will come across several terms that may be unfamiliar.
Understanding these terms can help you better analyze and optimize your content strategy.
For a detailed explanation of each of the terms mentioned in the LinkedIn post analytics, scroll down to the section “LinkedIn Analytics Terms & Metrics To Understand”.
Step 5: Use the filters to view analytics data for different time periods or audience segments
If you want to view analytics data for a specific time period or audience segment, you can use the filters at the top of the analytics page.
You can filter the data by date range, audience demographics, and post type.
Note: this functionality may not be available for posts after a certain time period.
Step 6: Download the analytics data in a CSV file
If you want to analyze the data further, you can download it in a CSV file. To do this, click the "Export all data" button at the top of the analytics page.
This will download a CSV file that contains all of the data related to your post's performance.
Detailed notes on your LinkedIn Analytics (e.g. how long demographic data is available for) are available here.
LinkedIn Analytics Terms & Metrics To Understand
Understanding these terms can help you gain valuable insights into your post's performance on LinkedIn.
Views: The number of times your post was viewed by LinkedIn members.
Impressions: The number of times your post was shown to LinkedIn members, regardless of whether they clicked on it or engaged with it.
Clicks: The number of clicks your post received, including clicks on links, hashtags, and your company logo or name.
Engagement rate: The percentage of people who engaged with your post, divided by the total number of impressions. Engagement includes likes, comments, and shares.
Likes: The number of times your post was liked by LinkedIn members.
Comments: The number of comments your post received from LinkedIn members.
Shares: The number of times your post was shared by LinkedIn members.
Follows: The number of people who followed your LinkedIn Page after viewing your post.
Demographics: Information about the LinkedIn members who viewed your post, such as their job title, company size, seniority, and location.
Time period: The date range for the post analytics data.
Audience segment: The specific audience segment you want to view analytics data for, such as all LinkedIn members, your company followers, or specific target audiences you have created.
Post type: The type of post you shared, such as an article, image, or video.
By analyzing this data, you can optimize your content strategy and improve engagement with your audience.
Additionally, there are further analytics available for your LinkedIn Page and also as a “Creator”.
How To Grow Your Network On LinkedIn With Content & Thought Leadership
In conclusion, tracking your post analytics on LinkedIn is essential to understanding your audience's engagement with your content.
By following these six steps, you can gain valuable insights into how your posts are performing and use that information to optimize your content strategy.
Are you looking to position yourself as a thought leader in your industry?
At Cleverly, we’ve helped hundreds of clients build authority, effectively market their products and services, and powerfully scale their businesses to new levels with our LinkedIn content marketing.
Learn more about our LinkedIn content services here or book a call with one of our strategists for a free consultation.


